


Compressed air is often called the fourth utility and is one of the most expensive energy sources used in industrial plants.
Problem
Most compressed air systems run very inefficiently and often system owners are unaware of the scale of the problem. Those system owners who are aware of the inefficiencies and who try to take action to improve their systems are frustrated because they do not have the tools to either verify the improvement projects or monitor the long-term effects of the improvements.
Solution
To start a compressed air improvement project the compressed air system needs to be evaluated. A high-speed data-logger designed specifically for compressed air audits can be used to gather the status of the compressed air system. Data-loggers have the ability to track and record system performance using one second intervals over seven-day periods to provide the detailed information critical in developing the best possible strategy to improve the compressed air system operation.
Example
In this real-life example the system had four compressors of various sizes (55 kW, 2 x 75 kW and 90 kW) making up the 295 kW of installed compressor power. The three largest compressors were turned on to run the plant and set to run in load/unload.
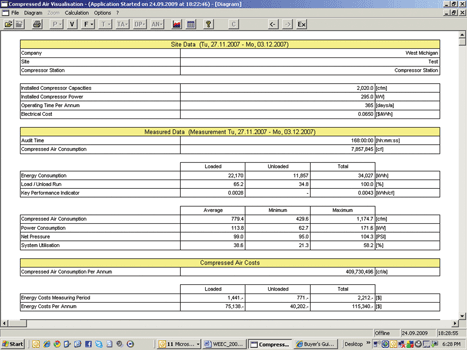
A 7-day compressed air audit was performed using an intelligent data-logger, providing charts, tables, performance data and cost information which allow an evaluation for each day of the week, the whole week and, by zooming in, the ability to analyse short-term events.
Figure 1 shows the resulting performance and cost information from the audit. This data was then used to calculate the energy saving potential of an improvement project.
Benchmarking
The key performance index (KPI) is the ‘compressed air system efficiency’ across all air compressors. Compressor efficiency is measured in kWh/100 CFM. The efficiency rating for all compressors is available from the Compressed Air and Gas Institute (CAGI) (www.cagi.org).
To calculate the best case theoretical ‘compressed air system efficiency’ across all compressors in the system, the CAGI data sheets were used to find the rated efficiency of each, allowing the theoretical system KPI to be calculated. In this example it worked out at 16,8 kWh/100 CFM.
This value can then be compared with the actual data from the data-logger based on real live compressor usage. In this example the measured ‘compressed air system efficiency’ from the data-logger was 0,0043 kWh/CF (see Figure 1) which evaluates to 25,8 kWh/100 CFM (0,0043 x 60 x 100).
There was thus an inefficiency gap between the actual KPI of 25,8 and the best case scenario of 16,8 kWh/100 CFM.
System solution
ARE believes that the simplest and fastest way to improve air compressor efficiencies is to install a management and on-line monitoring system to ensure that air supply (the air compressors) will automatically match compressed air demand in the plant.
The projected effect of installing an air management and monitoring system was calculated by using a simulation program. For the plant in this example the simulation program projected energy savings of 29,1% based on eliminating unload time energy and lowering the system pressure.
After the installation of the management system the actual operating results were evaluated over a period of one week. Figures 2 and 3 provide load/unload information comparing compressor system performance before and after installation.
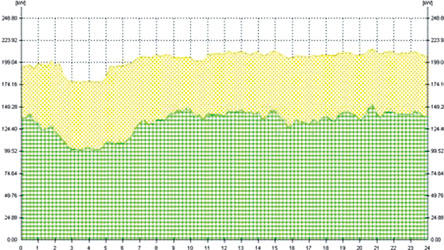
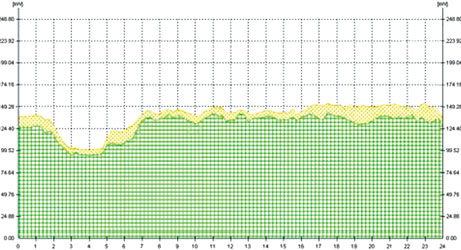
On this site the KPI was reduced from 25,8 kWh/100 CFM to 17,8 kWh/100 CFM, resulting in a relative efficiency improvement of 31% or 8 kWh/100 CFM. The management system ran the compressed air system very efficiently and on average only two compressors instead of three ran, resulting in substantial energy savings as well as reduced maintenance and service costs.
The 8 kWh/100 CFM savings result in an overall annual savings of approximately R292 000 at this site.
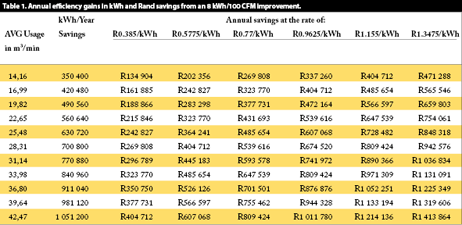
Savings potential
Table 1 illustrates potential savings provided by installing and properly using an air management system with web interface monitoring. It is based on variable consumption levels and power costs and an 8 kWh/100 CFM improvement. To find the cost savings go to the row with the appropriate average compressed air usage in m³/min and then select the column with the proper energy cost per kilowatt hour to easily identify the saving potentials in Rands that can result from installing a system like the Airleader Management and Monitoring System.
Continuous monitoring
After the initial audit an air management system with an integrated web-based monitoring system can provide all data necessary to verify the return on improvement projects. Such a system can also provide the information needed to manage a compressed air system, send alerts if set parameters are not met, verify energy efficiency results and provide the base for continuous improvement efforts.
Continuous monitoring records system performance and cost information. It illustrates the results of improvement efforts and immediately verifies the savings, from for example a leak project.
With continuous monitoring in place, different departments can be charged appropriately for their air consumption based on actual flow instead of floor area. This way each department can benefit from its compressed air savings.
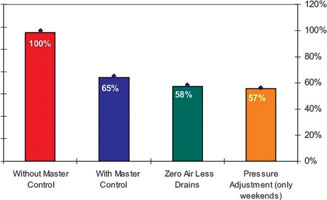
Figure 4 illustrates the results of improvement projects that are made possible through setting a baseline with a data-logging system and implementing an air management system incorporating continuous monitoring.
Conclusions
* Accurate and precise compressed air system information collected by a high-speed data-logger provides the base for compressed air improvement projects, since it concentrates on evaluating the maximum potential energy saving in a system.
* A self-learning air management system with live control and a web interface for on-line monitoring ensures that the air supply side (the air compressors) will automatically and most efficiently follow compressed air demand in the plant.
* Continuous monitoring records system performance and cost information, which help to illustrate the results of improvement efforts and immediately verify actual savings.
* If required, different departments can be charged for their air consumption based on actual flow instead of floor space. This way each department can benefit from its compressed air savings.
* The key performance index will be visible, the system more manageable and monitored on-line with alarms to notify system owners of malfunctions or unexpected events.
For more information contact Kevin Rushmer, Arthur Rushmer Engineering, +27 (0)11 908 4169, [email protected], www.are.co.za


© Technews Publishing (Pty) Ltd | All Rights Reserved

 printer friendly version